


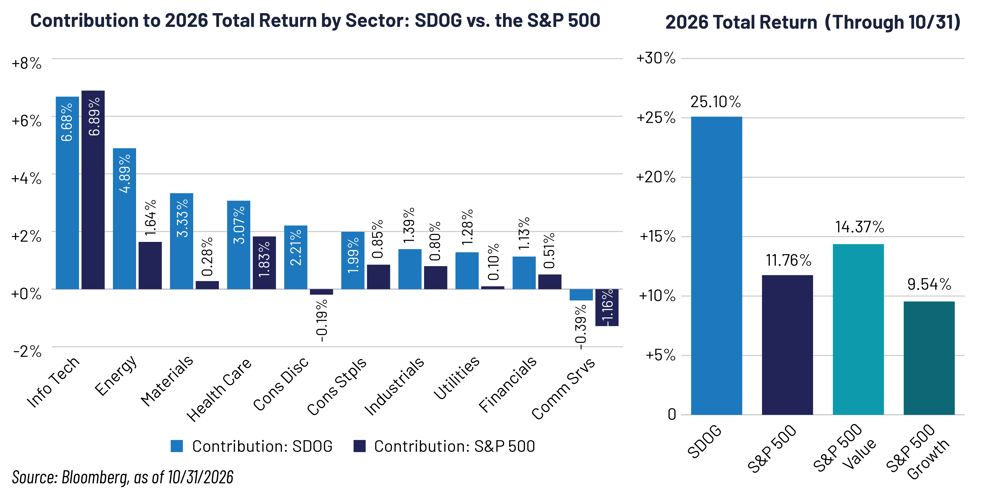
- Last month the ALPS Sector Dividend Dogs ETF (SDOG) gained 7.92%, outpacing the S&P 500 Index by 879 basis points (bps) and widening its lead over the Index in 2026 to 1,334 bps (25.10% vs. 11.76%). Meanwhile, the top-heavy S&P 500 slipped in October as worries over artificial intelligence (AI) spending and $100-plus oil pressured mega-cap technology, while a strong third-quarter earnings season and surging crude rewarded the cyclical and value sectors SDOG owns at full weight. All ten of SDOG’s sectors finished higher on the month, more than three-quarters of its holdings rose, and the Fund’s Technology allocation gained even as the sector fell.
- SDOG’s Energy names led the portfolio higher as Brent crude rose 13.6% to $117.64 a barrel, its highest settlement since late April, with the Strait of Hormuz effectively remaining closed and Houthi strikes hitting Saudi facilities. Independent producers ConocoPhillips (COP, 2.19% weight*) and EOG Resources (EOG, 2.20%*) returned 23.1% and 21.0%, respectively, and closed the month at record highs. So did Chevron (CVX, 2.15%*), which reported third-quarter earnings of $9.9 billion versus $3.5 billion a year earlier on record refining results. Bucking the technology selloff, Information Technology (IT) services leader, Accenture (ACN, 2.75% weight*), rallied 42.0% in October after reporting a beat on quarterly revenue ($18.68 billion vs. prior guidance of $17.75–$18.40 billion) and set a record 141 client bookings of $100 million or more. Accenture also raised the dividend 5% and added $6 billion of buyback authority.
- SDOG’s Materials and Industrials allocations told the same story: out-of-favor names repricing favorably on better-than-expected earnings results. Chemicals producer Dow Inc. (DOW, 2.34% weight*) gained 26.0% after third-quarter operating earnings per share (EPS) of $0.71 beat the $0.64 consensus and reversed a $0.19 loss a year earlier. Net sales rose 13% to $11.3 billion on a 14% increase in local price as the Hormuz disruption tightened polyethylene supply, and management guided fourth-quarter operating EBITDA to about $1.54 billion versus the $1.38 billion Wall Street expected. Global defense company Lockheed Martin (LMT, 2.38% weight*) climbed 25.1% against a flat Industrials sector in October, after beating third-quarter estimates on sales ($20.7 billion, up 11%) and EPS ($7.97 vs. expectations of $7.43), lifting its defense backlog to a record $292.0 billion and raising full-year guidance for the second straight quarter.
“If these results hold until the end of the earnings season, this will mark the first time the ‘Magnificent 7’ companies have reported lower earnings growth than the other 493 S&P 500 companies since Q4 2022.”
– John Butters, Vice President and Senior Earnings Analyst,
FactSet, Earnings Insight, October 30, 2026
Earnings Leadership is Broadening, and SDOG’s Sector Balance is Built for That
Despite renewed bouts of volatility, S&P 500 earnings growth is tracking +30.2% year over year, with all eleven sectors growing, led by Energy (+146.4%), Information Technology (+67.5%), and Materials (+30.6%).1 The five Magnificent 7 members that had reported as of October-end (Alphabet, Amazon, Meta, Microsoft, and Tesla) have, in aggregate, missed estimates by 14.7%, leaving the group tracking +22.6% earnings growth vs. +32.6% for the other 493 companies in the S&P 500. While it may be too early to call a permanent shift, the market is starting to reward current earnings and cash flow over ever-larger capital spending on longer-duration growth, and green shoots are appearing among more reasonably priced companies and under-owned sectors. Meanwhile, the economic backdrop remains supportive: third-quarter gross domestic product (GDP) rose at a +3.4% annual rate, and the Federal Reserve held at 3.75%–4.00% with two dissents favoring a hike.
SDOG’s edge is that it owns the broad market rather than its largest names. The Fund applies the Dogs of the Dow theory sector-by-sector to large-cap US equities, taking the five highest yielders in each of ten sectors (excluding Real Estate) from the 500 largest US stocks and equal-weights all 10 sectors and all 50 companies in the portfolio, so each sector starts near 10% and each stock near 2%. What that approach provides for investors is diversification, participation in every sector, income (Trailing Twelve Month (TTM) yield of 3.4%), and ample opportunities for large-cap stocks across the broad market to shift from “dogs” to winners.
Average 2026 sector weight in:
| Weight | Info. Tech. | Energy | Materials | Health Care | Cons. Disc. | Cons. Stpls. | Industrials | Utilities | Financials | Comm. Srvs. |
| SDOG | 10.4% | 10.1% | 10.2% | 10.1% | 9.9% | 9.9% | 9.9% | 9.8% | 10.0% | 9.6% |
| S&P 500 | 36.0% | 3.4% | 1.9% | 9.2% | 9.6% | 4.8% | 8.6% | 2.2% | 12.2% | 10.3% |
Source: Bloomberg, as of 10/31/2026
- Nine of SDOG’s ten sectors each added at least 1.1% to its 25.10% return this year, led by Technology (6.7%), Energy (4.9%), Materials (3.3%), and Health Care (3.1%), while Communication Services was the lone detractor (−0.4%). Comparatively, the S&P 500 drew 6.9% of its 11.8% total return from Technology alone—59% of the Index’s return from one sector—and only two other sectors (Health Care and Energy) contributed more than 1%. That sector diversification and breadth is why SDOG has outpaced the S&P 500 Index, the S&P 500 Value Index, and the S&P 500 Growth Index by more than 1,000 bps each in 2026.
- Why not just own a value, growth, or broad-market index fund? Because SDOG’s deep-value, yield-oriented portfolio has beaten all three this year without making a sector bet. Technology was 36% of the S&P 500 this year and produced 59% of its return. The growth Index leans on Tech to an even higher degree, and value funds need Financials and a handful of other sectors to carry them. SDOG spreads the load—ten sectors near 10% each, 50 stocks near 2%—so no single stock or sector dominates the outcome, and this year that balance put it ahead of value, growth, and the core S&P 500. For investors who want broad large-cap exposure paired with income, a value-tilt, and no single-sector concentration risk, SDOG may be a prime investment choice.
Performance Summary
| Cumulative | Annualized |
||||||||
| 1 M | YTD | 1 Y | 3 Y | 1 Y | 3 Y | 5 Y | 10 Y | SI | |
| SDOG - NAV (Net Asset Value) | 7.92% | 25.10% | 29.25% | 83.12% | 17.40% | 17.63% | 10.23% | 9.19% | 11.44% |
| SDOG - Market Price | 7.95% | 25.16% | 29.33% | 83.23% | 17.44% | 17.63% | 10.24% | 9.19% | 11.44% |
| S-Network Sector Dividend Dogs Index - TR | 7.98% | 25.61% | 29.89% | 85.31% | 17.94% | 18.09% | 10.62% | 9.61% | 11.91% |
| S&P 500 Index - TR | -0.87% | 11.76% | 12.11% | 87.92% | 15.74% | 22.89% | 13.79% | 15.33% | 14.92% |
Source: Bloomberg L.P. and SS&C ALPS Advisors, cumulative performance as of 10/31/2026 and annualized performance as of 09/30/2026
Performance data quoted represents past performance. Past performance is no guarantee of future results so that shares, when redeemed, may be worth more or less than their original cost. The investment return and principal value will fluctuate. Current performance may be higher or lower than the performance quoted. For current month-end performance call 1-866-759-5679 or visit www.alpsfunds.com. Performance includes reinvested distributions and capital gains.
Market Price is based on the midpoint of the bid/ask spread at 4 p.m. ET and does not represent the returns an investor would receive if shares were traded at other times.
Fund inception date: 06/29/2012
Total Operating Expenses: 0.36%
* Weight in SDOG as of 10/31/2026, subject to change
Sector Allocations
| Materials | 10.64% | Utilities | 10.07% | |
| Energy | 10.64% | Consumer Staples | 10.07% | |
| Information Technology | 10.28% | Consumer Discretionary | 9.63% | |
| Health Care | 10.20% | Financials | 9.44% | |
| Industrials | 10.11% | Communication Services | 8.81% |
As of 10/31/2026, subject to change
Real estate is excluded from the underlying index. Kenvue (Consumer Staples) was acquired by Kimberly-Clark on November 2, 2026; the sector holds four stocks until the December reconstitution. Cash and equivalents: 0.11%.
Important Disclosures & Definitions

An investor should consider the investment objectives, risks, charges and expenses carefully before investing. To obtain a prospectus containing this and other information, call 1-866-759-5679 or visit www.alpsfunds.com. Read the prospectus carefully before investing.

Shares of ETFs are bought and sold at market price (not NAV) and are not individually redeemable.

Performance data quoted represents past performance. Past performance is no guarantee of future results; current performance may be higher or lower than performance quoted.

All investments are subject to risks, including the loss of money and the possible loss of the entire principal amount invested. Additional information regarding the risks of this investment is available in the prospectus.

The Fund is subject to the additional risks associated with concentrating its investments in companies in the market sector.

Diversification does not eliminate the risk of experiencing investment losses.

The Fund employs a “passive management”—or indexing—investment approach and seeks investment results that correspond (before fees and expenses) generally to the performance of its Underlying Index. Unlike many investment companies, the Fund is not “actively” managed. Therefore, it would not necessarily sell or buy a security unless that security is removed from or added to the Underlying Index, respectively.

Companies mentioned are holdings of the Fund as of the dates shown and are discussed for illustrative purposes only; they are not recommendations to buy or sell any security. Company return figures are October 2026 total returns based on exchange prices and dividends.

1 FactSet, Earnings Insight, October 30, 2026

Basis point (bps): a unit that is equal to 1/100th of 1% and is used to denote the change in a financial instrument.

Earnings Before Interest, Taxes, Depreciation and Amortization (EBITDA): a measure of a company’s overall financial performance.

Dogs of the Dow Theory: an investment strategy which proposes that an investor annually select for investment the ten Dow Jones Industrial Average stocks whose dividend is the highest fraction of their price.

Magnificent 7: a group of seven high-performing and influential stocks in the technology sector including Apple, Microsoft, Alphabet, Amazon, Nvidia, Tesla and Meta.

S-Network Sector Dividend Dogs Index (SDOGX): a rules-based index intended to give investors a means of tracking the overall performance of the highest dividend paying stocks in the S-Network US Equity WR Large-Cap 500 Index (SNR 500) on a sector-by-sector basis. The SNR 500 includes the 500 largest US stocks by market capitalization. The index selects the five highest-yielding stocks in each of ten GICS sectors (excluding real estate) as of the last business day of November, equally weights them, rebalances quarterly and reconstitutes annually in December.

S&P 500 Index: widely regarded as the best single gauge of large-cap US equities. The index includes 500 leading companies and covers approximately 80% of available market capitalization.

30-Day SEC Yield: reflects the dividends and interest earned during the period, after the deduction of the Fund’s expenses.

One may not invest directly in an index.

ALPS Advisors, Inc., registered investment adviser with the SEC, is the investment adviser to the Fund. ALPS Advisors, Inc. is affiliated with ALPS Portfolio Solutions Distributor, Inc.

ALPS Portfolio Solutions Distributor, Inc. is the distributor for the Fund.

Not FDIC Insured • No Bank Guarantee • May Lose Value

DOG001584  02/28/2027