
- Last month, the ALPS | O’Shares U.S. Small-Cap Quality Dividend ETF (OUSM) outperformed small-cap indices by over 300 basis points (bps) with its quality holdings operating well in a high interest rate backdrop. The Financials, Health Care and Consumer Discretionary sectors drove OUSM’s outperformance in January as resilient earnings, mergers & acquisitions (M&A) and strong balance sheets have allowed OUSM’s quality holdings to thrive.
- Pharmaceutical and healthcare solutions provider, Organon & Co. (OGN, 1.58% weight*), surged over 15% in January after reaffirming full-year revenue guidance and forecasting margin expansion in 2024. Also moving higher within OUSM’s Healthcare sector, Patterson Companies Inc. (PDCO, 1.46% weight*), a dental product and veterinary supplier, rose nearly 6% last month after being added to the S&P Small-Cap 600 Index. Within OUSM’s Financials sector, electronic trading marketplace, Tradeweb Markets Inc. (TW, 2.06% weight*), gained 4.96% in January after reporting record-breaking Q4 ‘23 average daily trading volume, which resulted in 26% year-over-year revenue growth. M.D.C. Holdings, Inc. (MDC, 0.72% weight*) led OUSM’s Consumer Discretionary sector last month, climbing over 13% after the single-family homebuilder agreed to be bought by Sekisui House (1928 JP, not in OUSM) at a 19% premium to its prior day closing price.
- Leading all gains in the fund, Juniper Networks, Inc. (JNPR, 2.38% weight*) soared over 25% in January after Hewlett Packard Enterprise (HPE, not in OUSM) offered to buy the company at a 32% premium to its prior day closing price. Within OUSM’s Consumer Staples sector, WD-40 Co. (WDFC, 0.48% weight*), also jumped nearly 9% in January following an impressive quarterly release that saw earnings per share and net sales higher than expected on notable unit volume growth. Lastly, Financials company, Primerica Inc. (PRI, 1.94% weight*), gained over 13.80% during the month after pre-releasing robust 2023 underwriting metrics within its term-life insurance business that amounted to $119B of coverage.
“January 19th marked the first time in history that the S&P 500 hit an all-time high while the Russell 2000 was in a bear market. Historically, large Russell 2000 drawdowns surrounding S&P 500 peaks have been a bullish indicator for both small and large caps, with the former outperforming on average. Attractive valuations, a positive economic outlook, and strong upside potential inform our favorable view on small caps in the year ahead.”
– Goldman Sachs Asset Management, January 26, 2024
The Large & Small Cap Divergence Can’t Last Forever
- The possibility of interest rate cuts in 2024 has brightened prospects for U.S. small-caps, which are likely to see a greater positive effect from more attractive lending conditions, valuation discount rates and a pickup in economic activity. Despite outsized gains for broad large-cap indices in 2023 and into 2024, there is an extraordinary amount of pricing risk in large-cap indices due to the high concentration of the largest SEVEN mega-cap stocks (Mag7), which now comprise a record 28% of the S&P 500 and have contributed to over 60% of the S&P 500’s returns over the last year. Furthermore, large-cap valuation multiples relative to small-caps are, once again, nearing decade highs at a point where lofty valuations on the Mag7 will need to be supported by near-perfect execution and fundamentals.
- Where risks remain for small-caps until financial conditions begin to ease, a quality-focused small-cap approach based on strong fundamentals can help mitigate volatility and capitalize on the reversion to the mean of the Price-to-Earnings (P/E) spread between large-cap and small-cap companies. The ALPS | O’Shares U.S. Small-Cap Quality Dividend ETF (OUSM) exhibits superior fundamentals across its quality screens, including high return on assets (ROA), low leverage and strong dividend growth, setting it apart from its small-cap quality peers.
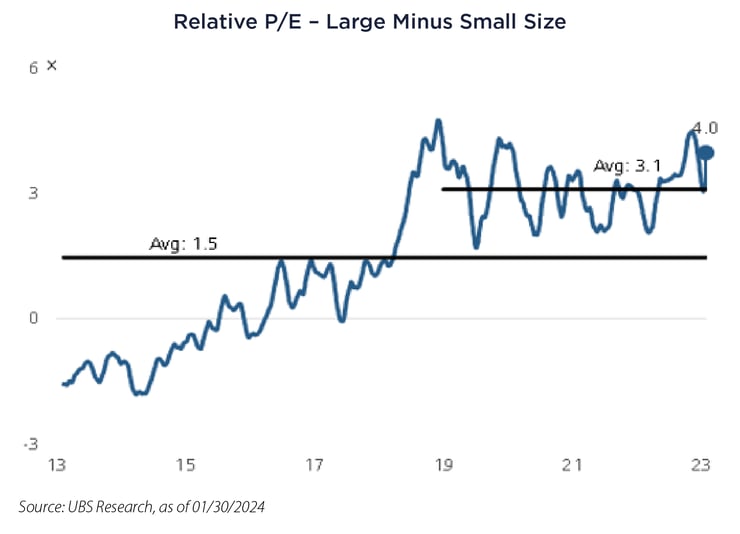
- Large-cap stocks are currently trading 4 turns higher than small-cap stocks, which is 2.5 turns above the 10-year average and nearly 1 turn above the 4-year average where a reversion to the mean is not a question of “if” but “when”.
- OUSM currently trades at a 15x Forward P/E versus 17x for the Russell 2000 Index. Additionally, over 17% of the Russell 2000 holdings are not expected to produce any earnings over the next year while all of OUSM’s holdings are expected to be profitable.^
Performance Summary
| Cumulative | Annualized |
|||||||
| 1 M | YTD | 1 Y | 3 Y | 1 Y | 3 Y | 5 Y | SI | |
| OUSM - NAV (Net Asset Value) | -0.79% | -0.79% | 7.95% | 33.25% | 7.95% | 10.02% | 10.76% | 8.61% |
| OUSM - Market Price | -0.80% | -0.80% | 7.94% | 33.17% | 7.94% | 10.00% | 10.78% | 8.65% |
| O’Shares U.S. Small-Cap Quality Dividend Index - TR1 | -0.75% | -0.75% | 8.43% | 35.10% | 8.43% | 10.53% | 12.81% | 12.11% |
| Morningstar US Small-Cap Broad Value Extended Index - TR2 | -4.00% | -4.00% | 0.02% | 22.91% | 0.02% | 7.01% | 7.46% | 5.54% |
| Russell 2000 Value Index - TR | -4.54% | -4.54% | -0.16% | 13.90% | -0.16% | 4.43% | 6.70% | 5.23% |
Source: Bloomberg L.P. and SS&C ALPS Advisors, cumulative performance as of 01/31/2024 and annualized performance as of 12/31/2023
Performance data quoted represents past performance. Past performance is no guarantee of future results so that shares, when redeemed, may be worth more or less than their original cost. The investment return and principal value will fluctuate. Current performance may be higher or lower than the performance quoted. For current month-end performance call 1-866-759-5679 or visit www.alpsfunds.com. Performance includes reinvested distributions and capital gains.
Market Price is based on the midpoint of the bid/ask spread at 4 p.m. ET and does not represent the returns an investor would receive if shares were traded at other times.
Performance data prior to 06/21/2022 reflects the performance of the Fund as managed under the OSI ETF Trust.
Fund inception date: 12/30/2016, date reflects the commencement of investment operations.
1 The O’Shares U.S. Small-Cap Quality Dividend Index performance information reflects the blended performance of the FTSE USA Small Cap Qual/Vol/Yield 3% Capped Factor Index through 05/03/2018, the FTSE USA Small Cap ex Real Estate 2Qual/Vol/Yield 3% Capped Factor Index from 05/04/2018 through 05/31/2020 and the O’Shares U.S. Small-Cap Quality Dividend Index thereafter.
2 Effective 03/31/2023, the Morningstar US Small-Cap Broad Value Extended Index replaced the Russell 2000 Value Index as the Fund’s secondary benchmark.
Total Operating Expenses: 0.48%
* Weight in OUSM as of 01/31/2024
^ As of 01/31/2024
Top 10 Holdings
| Williams-Sonoma Inc | 2.41% | Tradeweb Markets Inc | 2.06% | |
| Juniper Networks Inc | 2.38% | Owens Corning | 1.95% | |
| Lincoln Electric Holdings Inc | 2.24% | Primerica Inc | 1.94% | |
| Chemed Corp | 2.18% | New York Times Co/The | 1.90% | |
| Teleflex Inc | 2.17% | Encompass Health Corp | 1.87% |
As of 01/31/2024, subject to change
Important Disclosures & Definitions

An investor should consider the investment objectives, risks, charges and expenses carefully before investing. To obtain a prospectus containing this and other information, call 1-866-759-5679 or visit www.alpsfunds.com. Read the prospectus carefully before investing.

Shares of ETFs are bought and sold at market price (not NAV) and are not individually redeemable.

Performance data quoted represents past performance. Past performance is no guarantee of future results; current performance may be higher or lower than performance quoted.

All investments are subject to risks, including the loss of money and the possible loss of the entire principal amount invested. Additional information regarding the risks of this investment is available in the prospectus.

Concentration in a particular industry or sector will subject the Fund to loss due to adverse occurrences that may affect that industry or sector. The Fund may use derivatives which may involve risks different from, or greater than, those associated with more traditional investments. A Fund’s emphasis on dividend-paying stocks involves the risk that such stocks may fall out of favor with investors and underperform the market. Also, a company may reduce or eliminate its dividend after the Fund’s purchase of such a company’s securities.

The securities of small capitalization companies are often more volatile and less liquid than the stocks of larger companies and may be more affected than other types of securities during market downturns. Compared to larger companies, small capitalization companies may have a shorter history of operations, and may have limited product lines, markets or financial resources.

The Fund employs a “passive management” - or indexing - investment approach and seeks investment results that correspond (before fees and expenses) generally to the performance of its underlying index. Unlike many investment companies, the Fund is not “actively” managed. Therefore, it would not necessarily sell or buy a security unless that security is removed from or added to the underlying index, respectively.

Basis Point (bps): a unit that is equal to 1/100th of 1% and is used to denote the change in a financial instrument.

FTSE USA Small Cap ex Real Estate 2Qual/Vol/Yield 3% Capped Factor Index: comprised of securities within the FTSE USA Small-Cap Index, excluding Real Estate. The index is designed to reflect the performance of three recognized equity risk factors: quality, low volatility and yield.

FTSE USA Small Cap Qual/Vol/Yield 3% Capped Factor Index: designed to reflect the performance of high quality US small-cap equities exhibiting low volatility and high dividend yields. Quality is measured by profitability and leverage. Constituents are selected and weighted based on quality, volatility and yield characteristics.

Morningstar US Small-Cap Broad Value Extended Index: designed to provide comprehensive, consistent representation of the small cap value segment of the US equity market.

O’Shares U.S. Small-Cap Quality Dividend Index: designed to reflect the performance of publicly-listed small-capitalization dividend paying issuers in the United States that meet certain market capitalization, liquidity, high quality, low volatility and dividend yield thresholds. The quality and low volatility requirements are designed to reduce exposure to high dividend equities that have experienced large price declines.

Price/Earnings (P/E) Ratio: a valuation ratio of a company's current share price compared to its per-share earnings.

Russell 2000 Index: measures the performance of the small-cap segment of the US equity universe.

Russell 2000 Value Index: measures the performance of the small capitalization value sector of the US equity market.

S&P 500 Index: widely regarded as the best single gauge of large-cap US equities. The index includes 500 leading companies and covers approximately 80% of available market capitalization.

S&P Small-Cap 600 Index: seeks to measure the small-cap segment of the US equity market. The index is designed to track companies that meet specific inclusion criteria to ensure that they are liquid and financially viable.

One may not invest directly in an index.

ALPS Advisors, Inc., registered investment adviser with the SEC, is the investment adviser to the Fund. ALPS Advisors, Inc. and ALPS Portfolio Solutions Distributor, Inc., affiliated entities, are unaffiliated with O’Shares Investments.

ALPS Portfolio Solutions Distributor, Inc. is the distributor for the Fund.

Not FDIC Insured • No Bank Guarantee • May Lose Value

OUS000283  05/31/2024