
- Last month, the ALPS | O’Shares U.S. Small-Cap Quality Dividend ETF (OUSM) outperformed broad-based small-cap indices, returning 4.83% with multiple companies in OUSM reporting better-than-expected earnings and positive growth metrics.
- Within OUSM’s Consumer Discretionary allocation, home furnishing retailer, Williams-Sonoma Inc. (WSM, 3.61% weight*), was OUSM’s best-performing name in March and returned 34.82% after posting quarterly results above consensus estimates, thanks to notable margin stability as its new business model focuses on full-price selling and supply chain efficiencies. Also rising on strong earnings in March within OUSM’s Consumer Discretionary segment, Dick’s Sporting Goods Inc. (DKS, 2.31% weight*) rallied 27.03% after reporting earnings-per-share (EPS) well above analyst estimates after the company delivered record-breaking sales on strong consumer demand. Lastly, Choice Hotels International Inc. (CHH, 0.68% weight*), a Consumer Discretionary company focused on hospitality, gained 12.87% in March after scrapping plans for its $8 billion hostile takeover of Wyndham Hotels & Resorts (WH, 1.12% weight*) after Wyndham shareholders rejected the deal.
- Continuing the trend of improving small-cap company outlooks in OUSM, Vista Corp. (VST, 0.95% weight*) led gains within the OUSM’s Utilities allocation, gaining 28.14% in March after it completed the purchase of peer, Energy Harbor (ENGH). Another OUSM Utilities name, MGE Energy Inc. (MGEE, 0.11% weight*), surged nearly 25% in March after news broke that the company was chosen for inclusion in the S&P Small-Cap 600 Index. Finally, within OUSM’s Financials segment, mortgage origination and insurance providers, Radian Group Inc (RDN, 1.12% weight*) and MGIC Investment Corporation (MTG, 1.33% weight*) gained 14.86% and 12.42%, respectively, in March on better home buying trends in 2024 as well as the Federal Reserve (Fed) telegraphing interest rate cuts in 2024.
“Looking ahead, we believe there are multiple factors that support a catch-up in small-caps: As a reference, small-caps now trade at a 30% relative [price/earnings] P/E discount versus large-caps, while the longer-term average is closer to equilibrium. Thus, we believe the risk-reward is biased to the upside.”
– UBS Wealth Management, March 22, 2024
OUSM’s Holdings Continue to See Improving Fundamentals in 2024
- As the Mega-Cap tech trade has dominated headlines over the past year, it’s important to note that “Magnificent 7” companies are beginning to see a slowdown in their expected earnings growth in 2024. Meanwhile, despite their significant valuation discount relative to large-caps, small-caps offer a more positive earnings outlook and are expected to outpace large-cap EPS growth in 2024, per UBS. Specifically, OUSM’s average weighted earnings growth is expected to grow 7.6% in 2024 against the S&P 500 Index’s growth of 6.1%.^ As the beginning of the Fed easing cycle approaches (the UBS CIO expects the first 25 basis point cut in June) and access to capital continues to improve, the balance sheet and profitability outlook for small-caps should benefit relative to large-caps.
- Given over 30%^ of the Russell 2000 Index (small-cap) consists of unprofitable companies, it’s important to overlay the right quality screens when investing in small-cap funds, especially in a high interest rate regime. The ALPS | O’Shares U.S. Small-Cap Quality Dividend ETF (OUSM)’s top-decile small-cap ETF performance^ is backed by proven quality screens on profitability, dividend growth, low leverage and low volatility, providing a core small-cap investment without the added profitability risks seen in a broad-based small-cap index fund.
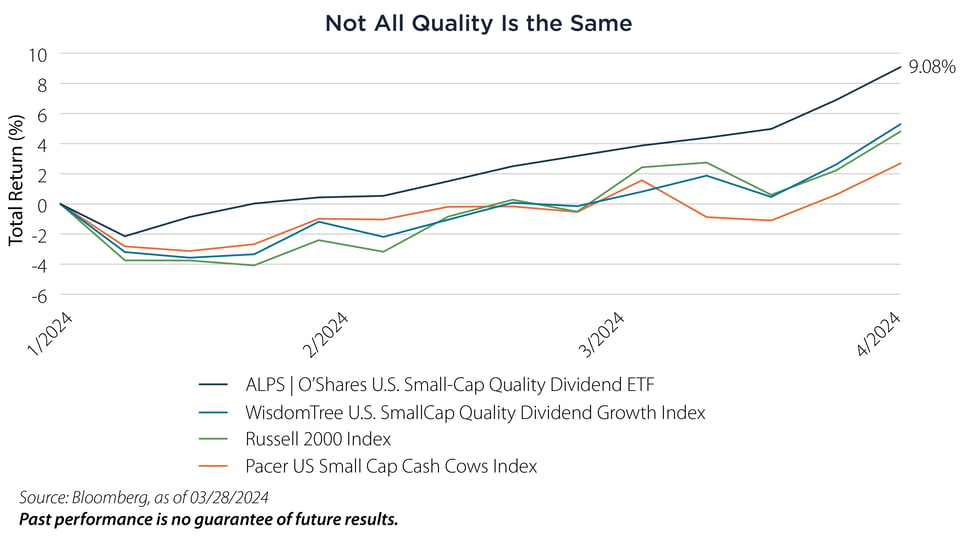
- Year-to-date, OUSM’s 9% return outpaces the Russell 2000 Index return of 5% as well as its small-cap quality peers, a function of high-caliber stock and sector selection given its distinctive quality methodology.
- Notably, OUSM’s 1-year trailing return of 22.70% and 1-year fund flow of $278 million surpasses the average small-cap quality ETF return of 19.47% and the average fund flow of $29 million over the same trailing period.
Performance Summary
| Cumulative | Annualized |
|||||||
| 1 M | YTD | 1 Y | 3 Y | 1 Y | 3 Y | 5 Y | SI | |
| OUSM - NAV (Net Asset Value) | 4.83% | 9.08% | 22.70% | 30.39% | 22.70% | 9.27% | 11.74% | 9.87% |
| OUSM - Market Price | 4.38% | 8.62% | 22.24% | 30.05% | 22.04% | 9.13% | 11.64% | 9.87% |
| O’Shares U.S. Small-Cap Quality Dividend Index - TR1 | 4.88% | 9.23% | 23.28% | 32.19% | 23.28% | 9.78% | 13.51% | 13.38% |
| Morningstar US Small-Cap Broad Value Extended Index - TR | 4.73% | 3.73% | 19.08% | 12.45% | 19.08% | 4.00% | 8.71% | 6.61% |
Source: Bloomberg L.P. and SS&C ALPS Advisors, as of 03/31/2024
Performance data quoted represents past performance. Past performance is no guarantee of future results so that shares, when redeemed, may be worth more or less than their original cost. The investment return and principal value will fluctuate. Current performance may be higher or lower than the performance quoted. For current month-end performance call 1-866-759-5679 or visit www.alpsfunds.com. Performance includes reinvested distributions and capital gains.
Market Price is based on the midpoint of the bid/ask spread at 4 p.m. ET and does not represent the returns an investor would receive if shares were traded at other times.
Performance data prior to 06/21/2022 reflects the performance of the Fund as managed under the OSI ETF Trust.
Fund inception date: 12/30/2016, date reflects the commencement of investment operations.
1 The O’Shares U.S. Small-Cap Quality Dividend Index performance information reflects the blended performance of the FTSE USA Small Cap Qual/Vol/Yield 3% Capped Factor Index through 05/03/2018, the FTSE USA Small Cap ex Real Estate 2Qual/Vol/Yield 3% Capped Factor Index from 05/04/2018 through 05/31/2020 and the O’Shares U.S. Small-Cap Quality Dividend Index thereafter.
Total Operating Expenses: 0.48%
* Weight in OUSM as of 03/31/2024
^ Source: Bloomberg, as of 03/28/2024
Top 10 Holdings
| Williams-Sonoma Inc | 3.61% | Tradeweb Markets Inc | 2.05% | |
| Lincoln Electric Holdings Inc | 2.35% | Encompass Health Corp | 1.99% | |
| Dick's Sporting Goods Inc | 2.31% | Owens Corning | 1.96% | |
| Juniper Networks Inc | 2.18% | Primerica Inc | 1.91% | |
| Chemed Corp | 2.16% | Texas Roadhouse Inc | 1.89% |
As of 03/31/2024, subject to change
Important Disclosures & Definitions

An investor should consider the investment objectives, risks, charges and expenses carefully before investing. To obtain a prospectus containing this and other information, call 1-866-759-5679 or visit www.alpsfunds.com. Read the prospectus carefully before investing.

Shares of ETFs are bought and sold at market price (not NAV) and are not individually redeemable.

Performance data quoted represents past performance. Past performance is no guarantee of future results; current performance may be higher or lower than performance quoted.

All investments are subject to risks, including the loss of money and the possible loss of the entire principal amount invested. Additional information regarding the risks of this investment is available in the prospectus.

Concentration in a particular industry or sector will subject the Fund to loss due to adverse occurrences that may affect that industry or sector. The Fund may use derivatives which may involve risks different from, or greater than, those associated with more traditional investments. A Fund’s emphasis on dividend-paying stocks involves the risk that such stocks may fall out of favor with investors and underperform the market. Also, a company may reduce or eliminate its dividend after the Fund’s purchase of such a company’s securities.

The securities of small capitalization companies are often more volatile and less liquid than the stocks of larger companies and may be more affected than other types of securities during market downturns. Compared to larger companies, small capitalization companies may have a shorter history of operations, and may have limited product lines, markets or financial resources.

The Fund employs a “passive management” - or indexing - investment approach and seeks investment results that correspond (before fees and expenses) generally to the performance of its underlying index. Unlike many investment companies, the Fund is not “actively” managed. Therefore, it would not necessarily sell or buy a security unless that security is removed from or added to the underlying index, respectively.

Basis Point (bps): a unit that is equal to 1/100th of 1% and is used to denote the change in a financial instrument.

FTSE USA Small Cap ex Real Estate 2Qual/Vol/Yield 3% Capped Factor Index: comprised of securities within the FTSE USA Small-Cap Index, excluding Real Estate. The index is designed to reflect the performance of three recognized equity risk factors: quality, low volatility and yield.

FTSE USA Small Cap Qual/Vol/Yield 3% Capped Factor Index: designed to reflect the performance of high quality US small-cap equities exhibiting low volatility and high dividend yields. Quality is measured by profitability and leverage. Constituents are selected and weighted based on quality, volatility and yield characteristics.

Morningstar US Small-Cap Broad Value Extended Index: designed to provide comprehensive, consistent representation of the small cap value segment of the US equity market.

O’Shares U.S. Small-Cap Quality Dividend Index: designed to reflect the performance of publicly-listed small-capitalization dividend paying issuers in the United States that meet certain market capitalization, liquidity, high quality, low volatility and dividend yield thresholds. The quality and low volatility requirements are designed to reduce exposure to high dividend equities that have experienced large price declines.

Pacer US Small Cap Cash Cows Index: a strategy driven index that aims to provide capital appreciation over time by screening the S&P Small-Cap 600 Index for the top 100 small-cap companies based on free cash flow yield.

Price/Earnings (P/E) Ratio: a valuation ratio of a company's current share price compared to its per-share earnings.

Russell 2000 Index: measures the performance of the small-cap segment of the US equity universe.

S&P 500 Index: widely regarded as the best single gauge of large-cap US equities. The index includes 500 leading companies and covers approximately 80% of available market capitalization.

S&P Small-Cap 600 Index: seeks to measure the small-cap segment of the US equity market. The index is designed to track companies that meet specific inclusion criteria to ensure that they are liquid and financially viable.

WisdomTree U.S. SmallCap Quality Dividend Growth Index: a fundamentally weighted index that consists of the small-capitalization segment of dividend-paying stocks with growth characteristics.

One may not invest directly in an index.

ALPS Advisors, Inc., registered investment adviser with the SEC, is the investment adviser to the Fund. ALPS Advisors, Inc. and ALPS Portfolio Solutions Distributor, Inc., affiliated entities, are unaffiliated with O’Shares Investments.

ALPS Portfolio Solutions Distributor, Inc. is the distributor for the Fund.

Not FDIC Insured • No Bank Guarantee • May Lose Value

OUS000300  07/31/2024